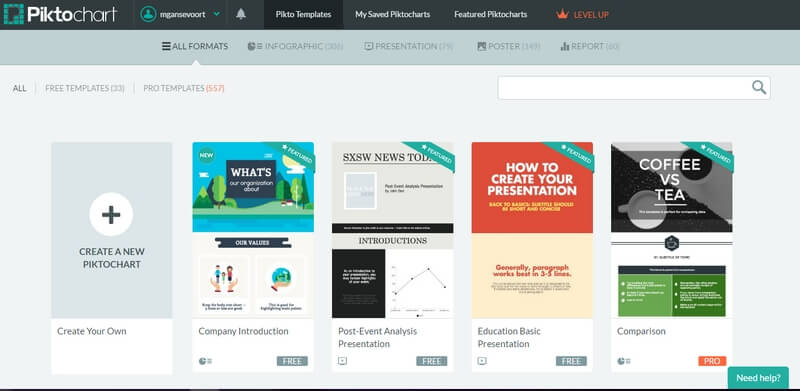
Piktochart is a user friendly tool to create infographics without having to hire a professional designer. Choose an infographic from hundreds of templates and you can start immediately.
Infographics are very popular to write about and depict a subject or topic in a clear and attractive way. On average, infographics are shared more often through social media than an article with text.
Piktochart is (partly) free
I have also once placed an infographic from someone else in the article 21 tips to get more newsletter readers. Sometimes the maker of the infographic places an embedded code with it which you can easily place on your website.
Piktochart is one of the best and most user friendly online tools to create an infographic (and poster, reports and presentations).
And it is free as well, if you only use the basic options.

You sign up and then you can get to work.
Piktochart, how does it work?
- Choose your template. You can choose from hundreds of templates, a part of which is free.
- Then you can edit the infographic, add text, photos, backgrounds, videos, cards, icons etc. There are a lot of options!
- When your infographic is ready you save it to your computer of you can instantly share it with others.
This is especially interesting for people who are not great writers but do want to publish something about a great topic.
And often you have created a ready made and very professional looking infographic after only a few hours.
Infographics are especially good to show all kinds of fun facts and things to know (in numbers).
A few more tips on how to make an infographic for your website:
- First come up with an angle of approach; What should the infographic be about?
- Research the content. Write down your own knowledge about the topic, but also look on the internet for additional facts and things to know.
- Create a visual design and choose a template for it and come up with a colour scheme. Look for accompanying photos and other images.
- Edit and perform the final editing on your own texts.
- Publish and share with others!
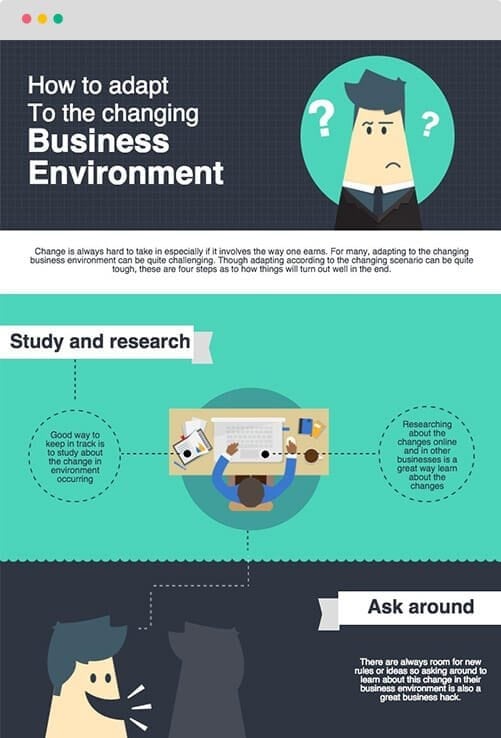
This is what the infographic looks like in the end:


